🌍 The #1 online live coding bootcamp

Become a Data Analyst

The Data Analytics Bootcamp is our flagship in-depth, flexible, world-class online live data analytics bootcamp.

We designed it to be easy-to-understand materials, with experienced instructors & impressive real-world projects to help you graduate with a great portfolio and prepare you for a successful career in tech.

We pride ourselves in our ability to deliver a global-level online live coding bootcamp experience that people charge in USD for, at 5x more affordable with Malaysian rates.

check icon

If you don't get a job in tech after you graduate, we will refund 100% of your tuition fees.

Overview

Overview

This course is all about learning the basics of data analytics. We don't just focus on the tools or computer languages; we teach you the key skills that matter. Data analytics is always changing, and we prepare you to be flexible and independent.

Are you ready to make a big change in your life? Want to learn how to make sense of data, or make your daily tasks easier? Then data analytics might be just what you're looking for.

This course is great for anyone. Whether you want to work from home, be your own boss, start a tech company, or just get a better job, we're here to help you all the way.

Don't worry if you're new to this. Our course is made for beginners. You don't need any experience to start. We'll teach you everything you need to know to get a job in data analytics quickly.

community photo
Sigma School Community

Learn the tech behind top companies like

google logo gray color
amazon logo gray color
meta logo gray color
netflix logo gray color
ibm logo gray color
microsoft logo gray color
apple logo gray color
uber logo gray color
airbnb logo gray color
grab logo gray color

How Will Sigma School's Data Analytics Course Future-Proof Your Career?

Data analytics skills are like a key to the future, opening doors in almost any career. Here's why learning data analytics is a smart move:

1. Your Passport to the Digital Age:
digital world

In today's world, being good with digital tools is essential, not just an extra skill. With data analytics, you can understand and use digital tools better, no matter what your job is. You could be a manager making smarter decisions, an artist analyzing trends for their art, or a marketer understanding customer behavior better.

2. Boost Your Problem-Solving Abilities:
problem solving

Data analytics is all about solving puzzles with information. It's like a brain exercise that makes you better at figuring things out. With these skills, you'll become the person who finds answers and makes smart decisions, no matter where you work.

3. Understand the Language of Data:
speaking

Ever felt lost when people talk about data and trends? That won't happen anymore! Learning data analytics means you'll not only understand these conversations but also lead them. You'll be ahead of the curve, able to talk about and use data in any job.

4. Automate to Make Things Easier:
automate

Learning data analytics lets you automate boring or repetitive tasks. Imagine being able to quickly analyze data without spending hours on it, whether you're in sales, research, or any other field. This skill saves you time and lets you focus on the more important parts of your job, pushing your career ahead.

Who is the Data Analytics Bootcamp for?

If you're starting from scratch and want to break into the tech industry.
software developer
Dreaming of starting your own tech-driven business? This is your first step.
tech entrepreneur
Looking to boost your resume? Perfect for project managers and others wanting to understand data.
project manager
Interested in using data to make everyday tasks simpler and more efficient.
personal dev explorers
Aimed at those who want a career that offers the freedom to work remotely, like freelancers.
freelancer
At a crossroads and looking for a new direction? This could be your starting point.
remote worker

...Then Sigma School's Data Analytics Bootcamp is for YOU! 🎉

Our bootcamp is tailored to help you achieve your goals in 40 weeks or less. We provide all the resources and guidance you need to become proficient in data analytics.

Just bring your enthusiasm, be ready to learn, and we'll show you the most straightforward and effective path to achieving your goals!

Enroll Now

Our Brand Promise

1

If you don't get a tech job after graduation, you get 100% of your money back.

2

If you don't get a tech job after graduation, you get unlimited support for 1 year until you do.

3

Get help within 5 minutes. If we don't, a meal on us!

4

If you find better coding slides than us, we will give you RM100.

5

If you find any issues in our course and we don't resolve it within 1 day, we will give you RM100.

Your future after the course

Jobs you will be able to land

Data Analyst

Excel Specialist

Business Intelligence Analyst

SQL Database Developer

Data Visualization Expert

Business Analyst

Dashboard Developer

Data Quality Manager

E-commerce Data Analyst

Marketing Data Analyst

Financial Analyst

Research Analyst

Data Science Associate
(Entry-level)

Python Developer

Customer Insights Analyst

Sales Data Analyst

Skills you can use to make your resume impressive

SQL

Python

Excel

Jupyter

Pandas

Graphs

Data Visualization

Statistical Analysis

Data Cleaning

Report Generation

Dashboard Creation

Databases

Plotly

vacancies

Your demand in the labor market

Nowadays, every type of business knows how important it is to make choices based on facts and figures. That's why they really want people who can understand numbers and information and use them to make good decisions. As more companies focus on using information to guide their plans, being good at analyzing data is becoming a must-have skill.

Your salary and career prospects

The following are the average monthly salaries for data analytics roles in Malaysia, as per the latest market data. With the growing global need for data expertise, you may earn even more when you secure positions in international markets:

Starting Data Analyst, with 2 years' experience

Senior Data Analyst with some experience, 2-5 years in the job

Data Scientis, over 5 years in the job

Follow the 4-step employment plan

1. Improve your technical skills

technical skills

Our team of instructors will work with you to go hands-on to master cutting-edge technologies to solve complex problems and build impressive projects.

2. Improve your soft skills

soft skills

Learn to communicate complex ideas effectively, making your presentations stand out. Our career instructors and career coaches will work with you on showcasing your projects collaborating in remote teams.

3. Boost your personal branding

personal branding

Work on real world projects to fill up your Linkedin and GitHub profiles. Work with your personal career consultant to write effective cover letters and attend mock interviews with professional recruiters.

4. Get your first tech job!

tech job

We will not stop working with you until you land your first tech job. As long as you don't give up, we wont give up on you too! Leverage your newly acquired skills and personal brand to land your dream tech job.

With a whole team to support you on the way

Education Team - Instructors

These are the key people who deliver the curriculum. They have strong expertise in the subject matter and are passionate about teaching and mentoring.

instructors

Education Team - Teaching Assistants

They support instructors by helping students troubleshoot issues, understand concepts, and complete projects.

teaching assistants

Careers Team - Placement Officers

They maintain relationships with hiring partners and assist in placing graduates in appropriate roles post-bootcamp.

placement officers

Careers Team - Career Coaches

They will guide students in their job search, helping them improve their resume, prepare for interviews, and navigate job offers.

career coaches

Operations Team - Program Manager

They oversee the operations of the bootcamp, from scheduling classes to ensuring the smooth delivery of the program.

program managers

Operations Team - Student Success Manager

They focuses on student retention and success, providing academic support and helping students overcome any hurdles they might encounter during the program.

student success managers
Curriculum

Curriculum

Module 1: Mastering Data Analysis with Excel

Foundation to Advanced Excel: Start from scratch and learn Excel, a key software tool for data analysis. You'll learn how to organize, analyze, and visualize data using Excel's various features.

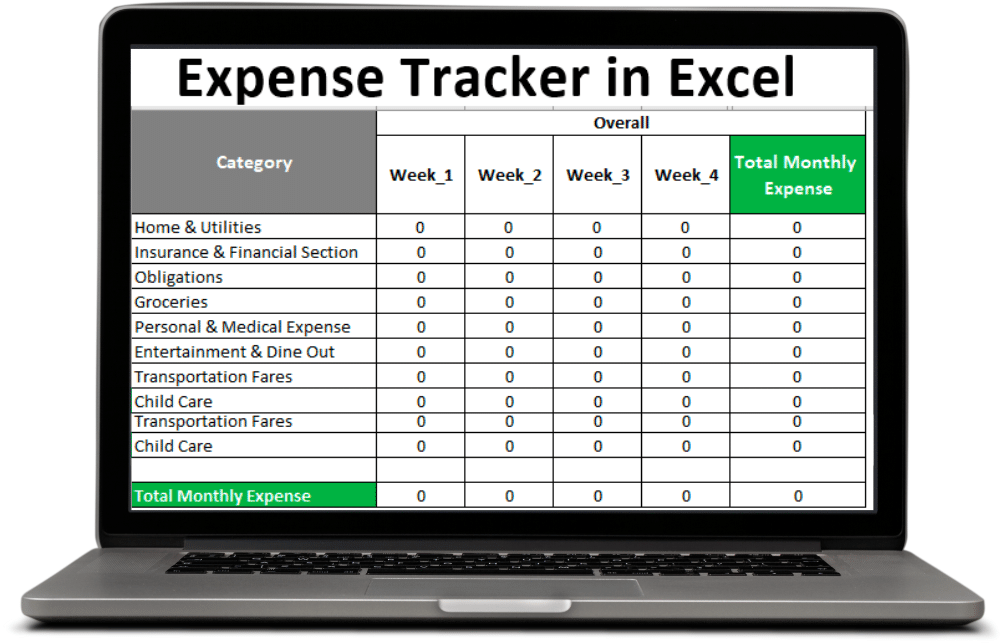
Real-World Projects: Apply your skills to create budget planners, which help in managing finances, and detailed sales reports, simulating the analysis of business performance.

Chapter 1 - Welcome

Introduction to the course, its structure, and what students will learn.

Chapter 2 - Introduction to Excel

Basics of Excel's interface, worksheet elements, and a mini-project on personal budgeting.

Chapter 3 - Basic Excel Functions

Overview of basic Excel functions and arithmetic operations with a project on monthly sales reporting.

Chapter 4 - Formatting Data

Techniques for data types and conditional formatting in Excel, including a customer feedback analysis project.

Chapter 5 - Capstone Project: Budget Planner

Design a comprehensive budget planner using Excel to apply learned skills.

Chapter 6 - Data Manipulation and Cleaning

Introduction to data validation, managing duplicates, and various Excel functions for cleaning data.

Chapter 7 - Data Manipulation and Cleaning 2

Exploration of logical functions, VLOOKUP, INDEX, MATCH, and a project on sales commission calculation.

Chapter 8 - Data Sorting and Filtering

Techniques for sorting and filtering data in Excel, including an inventory management project.

Chapter 9 - Data Aggregation

Learning statistical functions in Excel with a mini-project on sales performance analysis.

Chapter 10 - Capstone Project 2: Monthly Sales Data

Analyze a small retail store's monthly sales data to extract insights and present findings.

Chapter 11 - Pivot Table

Introduction to PivotTables, their customization, and a project on inventory analysis.

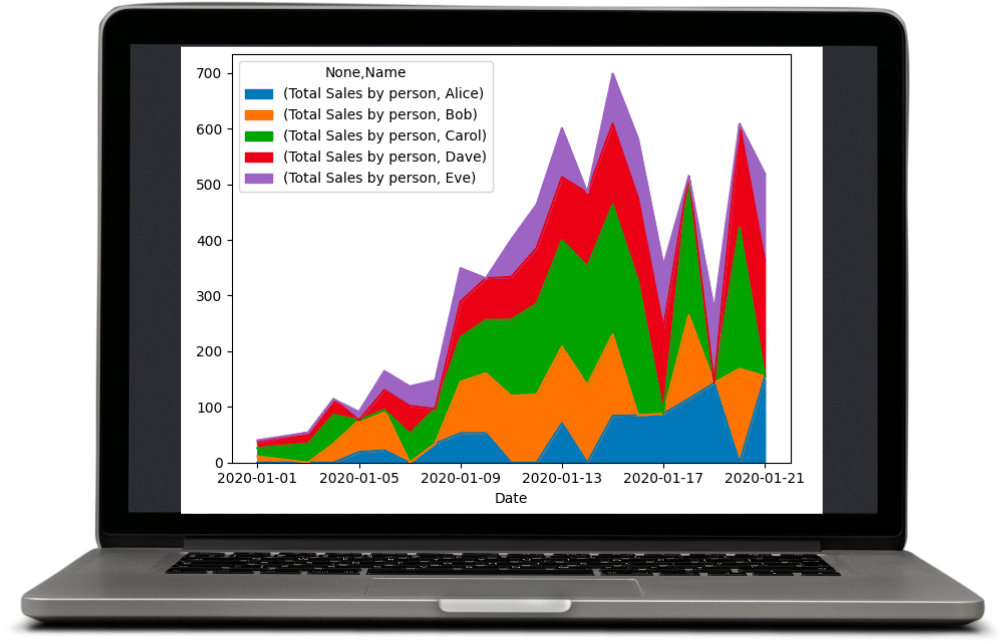
Chapter 12 - Charting and Visualization 1

Basic principles of charting and visualization with Excel, including a sales trend analysis project.

Chapter 13 - Charting and Visualization 2

Advanced visualization techniques like histograms and heatmaps for customer feedback analysis.

Chapter 14 - Charting and Visualization 3

PivotCharts, interactive filters, and a mini-project on dynamic sales reporting.

Chapter 15 - Capstone Project 3

Create a comprehensive and interactive sales performance dashboard in Excel.

Module 2: SQL and Databases

Database Fundamentals with SQL: Understand the backbone of data storage — databases. Learn SQL, the language used to communicate with databases, to retrieve and manipulate data effectively.

Real-World Projects: Engage in projects that replicate the analysis of e-commerce data, helping you grasp how data drives business decisions.

Chapter 1 - Welcome

Introduction to databases, SQL, and setting up a SQL server.

Chapter 2 - Understanding Tables and Database Schemas

Exploring database schemas, data types, and a project on creating and populating tables.

Chapter 3 - SQL Basics: Querying Data

Basics of SQL querying, including a project on crafting SQL queries.

Chapter 4 - Data Aggregation with SQL

Learning SQL aggregation functions and a project on revenue analysis.

Chapter 5 - Capstone Project: E-commerce Data Analysis using SQL

Analyze data of an e-commerce platform using SQL.

Chapter 6 - Advanced Filtering and Data Manipulation

Advanced SQL filtering techniques and a mini-project on user categorization.

Chapter 7 - SQL Joins

Understanding and applying different types of SQL joins.

Chapter 8 - Subqueries and Derived Tables

Introduction to subqueries and derived tables in SQL.

Chapter 9 - Set Operations in SQL

Learning set operations in SQL and their application in analysis.

Chapter 10 - Capstone Project: E-commerce Data Analysis using SQL 2

A continuation of e-commerce data analysis using advanced SQL techniques.

Chapter 11 - Data Modification with SQL

Techniques for data insertion, update, and deletion in SQL databases.

Chapter 12 - Advanced SQL - Windowing Functions

Understanding and using window functions in SQL.

Chapter 13 - Advanced Windowing with PARTITION BY and ORDER BY

Advanced techniques in window functions focusing on PARTITION BY and ORDER BY.

Chapter 14 - Diving Deeper: ROW_NUMBER, LAG, LEAD

Exploring specific window functions like ROW_NUMBER, LAG, and LEAD.

Chapter 15 - SQL in the Real World: Best Practices

Best practices in writing and optimizing SQL queries.

Chapter 16 - Capstone Project: Analyzing a Music Streaming Platform's User Behavior

Analyze user behavior on a music streaming platform using SQL.

Chapter 17 - Interview Technical Assessment - SQL

Technical assessment challenge for SQL skills.

Module 3: Reports & Dashboards with Looker Studio

Data Visualization with Looker Studio: Delve into Looker Studio, a modern tool for creating data visualizations, which are graphical representations of data. Learn to create dashboards that summarize and present data insights clearly.

Real-World Projects: Design interactive and informative dashboards that narrate a data story, crucial for business strategies and decisions.

Chapter 1 - Introduction to Looker and Data Visualization

An overview of Looker Studio and the significance of data visualization in business.

Chapter 2 - Basics of Data Exploration in Looker

Learning how to explore data and create visualizations in Looker.

Chapter 3 - Basic Charting Tools

Introduction to basic charting tools in Looker and their usage scenarios.

Chapter 4 - Advanced Charting Techniques

Exploration of advanced charting techniques like heat maps and scatter plots in Looker.

Chapter 5 - Dashboard Layout and Arrangement Principles

Understanding principles for effective dashboard design and layout in Looker.

Chapter 6 - Capstone Project: E-Commerce Sales Performance Dashboard

Develop an interactive e-commerce sales performance dashboard using Google Looker Studio.

Chapter 7 - Looker's Filtering and Drill-Down Features

Learning about interactive filtering and drill-down features in Looker.

Chapter 8 - Business Acumen in Data Visualization

Tailoring dashboards to different stakeholders and understanding business requirements.

Chapter 9 - Storytelling through Dashboards

Techniques for narrating stories with data using sequential dashboards in Looker.

Chapter 10 - Data Integration

Integrating different data sources with Looker and optimizing for data freshness and cost.

Chapter 11 - Looker X SQL X Joins

Writing custom SQL in Looker and understanding its performance tuning.

Chapter 12 - Looker Joins

How to join datasets in Looker and the cost implications.

Chapter 13 - Performance Tuning and Optimization

Optimizing Looker dashboards for faster load speeds and data freshness.

Chapter 14 - Capstone Project: Competitor Analysis Dashboard

Create a dashboard to analyze and compare performance metrics with competitors using Looker Studio.

Module 4: Python for Data Exploration

Python Programming for Data: Explore Python, a popular programming language, especially in data analytics. Learn to use Pandas for data manipulation (organizing and adjusting data) and Plotly for creating engaging data visualizations.

Real-World Projects: Address real-life data challenges, using actual datasets to enhance your analytical skills and prepare you for the demands of a data analytics role.

Chapter 1 - Introduction to Python and Pip

Overview of Python, its role in data analysis, and steps for setting up the Python environment.

Chapter 2 - Python Basics: Strings and Numbers

Learning basic data structures like strings and numbers in Python.

Chapter 3 - Python Basics: Lists and Tuples

Introduction to complex data structures like lists and tuples in Python.

Chapter 4 - Python Basics: Dictionaries and Sets

Exploring dictionaries and sets in Python for data organization.

Chapter 5 - Python Conditional Flow: Loops

Understanding control flow in Python with loops and conditional statements.

Chapter 6 - Python Conditional Flow: Functions

Basics of Python functions, their definition, and usage.

Chapter 7 - Pandas and Numpy

Introduction to Pandas and Numpy libraries in Python for data manipulation.

Chapter 8 - Data Selection and Filtering with Pandas

Techniques for selecting and filtering data using Pandas in Python.

Chapter 9 - Data Aggregation using Pandas

Learning data aggregation functions in Pandas for data analysis.

Chapter 10 - Data Cleaning in Pandas

Handling missing data and data type conversions in Pandas.

Chapter 11 - Advanced Data Manipulation with Pandas

Advanced data manipulation techniques using Pandas in Python.

Chapter 12 - Joining and Concatenating Data with Pandas

Techniques for joining and concatenating data using Pandas.

Chapter 13 - Pandas GroupBy Mechanics

Exploring the GroupBy functionality in Pandas for grouped data analysis.

Chapter 14 - Capstone Project: Sales Analysis and Reporting Tool

Building a sales analysis and reporting tool using Python and Pandas.

Chapter 15 - Exploring Data Visualization with Plotly

Introduction to data visualization with the Plotly library in Python.

Chapter 16 - Advanced Charting with Plotly

Advanced charting techniques and customization with Plotly.

Chapter 17 - Interactivity in Plotly: Dropdowns and Menus

Adding interactivity to Plotly charts with dropdowns and menus.

Chapter 18 - Interactivity in Plotly: Buttons and Sliders

Incorporating buttons and sliders for dynamic visualizations in Plotly.

Chapter 19 - Capstone Project - Titanic Dataset

Analyzing and visualizing the Titanic dataset to understand passenger survival factors.

Chapter 20: Interview Assessment - Python & Data Exploration

Technical assessment challenge for Python and data exploration skills.

Team

Meet our team

deric
Deric Yee
Founder
5 Years of Software Development Experience
Taught to over 100 students
Bachelors in Lancaster University
lancaster university logo

Find out more

pavi
Nicholas
Data Engineer at Chope
5 years of Data Analytics and Engineer Experience
Top Data Engineer Voice on LinkedIn with 10,000 followers
chope logo
haris
Haris Samingan
Head of Bootcamp
ex-Google Developer Expert
5 Years of Software Development Experience
Taught in Top Singapore Universities
google logonanyang technological university logosingapore management university logo

Find out more

Projects

Learn By Building

Don't just take our word for it

We've trained hundreds of students now, here's what they have to say

This is what our students have said about our courses

Statistical data from surveying our alumni
software developer

9/10: The average rating students
give for EVERY lesson.

tech entrepreneur

5/5 star ratings by our
students on Google Review.

project manager

86% say they'd recommend
our Bootcamp to others.

personal dev explorers

99% of students say the content was
clear and easy to understand and follow.

personal dev explorers

9/10 of our students enjoy
the real-world projects we cover.

personal dev explorers

88% of our students learn new tech
stacks at least 2x faster after
completing Level 1 of the course

Tuition Plans

We offer a variety of payment options to suit your needs.
 
Data Analytics Bootcamp

Duration

Duration

40 weeks


Weekly live online lectures and workshops

Duration

Once a week: 8:30pm to 10:30pm


Priority support

Priority support


Group mentoring

Group mentoring


Recorded live lessons

Recorded live lessons


Money back if you don’t get a job

Money back if you don’t get a job


Requirements

Requirements

None, start as soon as the first class


Upfront tuition

Upfront tuition

Pay RM 7,997 upfront


Pay Upfront

Pay in full before you begin, at the lowest price possible. No add on costs, and nothing to pay when you're done.


Pay Upfront

RM 7,997

RM 10,997

Total cost

Month to Month

Pay the same amount in tuition each month.


Total cost

Month to Month

RM 1,497

Monthly payment

RM 8,982 (RM1,497 x 6 months)

12x Installment

Enjoy the flexibility of spreading your tuition fee over 12 months, interest-free. Available with participating Malaysian banks only.


Total cost

12x Installment

RM 666.424

Monthly payment

RM 7,997 (RM666.42 x 12 months)

Program discounts are available for fresh graduates. Ask our Administrative Representative to find out more.

Our 100% Money Back Guarantee

At Sigma School, we believe we only win if our students win. We're so confident that our programs provide a direct path to a tech job that we offer this 100% money back guarantee to our students.


To qualify, students must meet and maintain eligibility as outlined below:

  • You graduated from the Data Analytics Bootcamp, receiving a Certificate of Completion.
  • You are of legal working age and legally authorised to work in the country that you wish to seek employment in.
  • You actively seek employment, perform your career commitments set out by our careers team and attend interviews scheduled.


As long as you complete the programme and graduate from it, but still fail to land a job in tech, we will refund you 100% of your tuition fees paid to us.

Show me another person who's willing to stand behind their product like this!

Leverage on the Data Analytics Bootcamp to break into tech, land tech jobs, start freelancing or build your own tech startup.

All 100% risk-free.

Sounds like a no-brainer?Join now!

Frequently Asked Questions

Is the Data Analytics Bootcamp suitable for beginners?
chevron down icon

YES! Our course covers everything from the BASICS to the most ADVANCED topics in data analytics. This part-time program is designed for both total beginners and those with some experience. Whether you have ZERO experience in data analytics or are looking to enhance your skills, this course is meant for you!

I'm not good at math. Can I still be a data analyst?
chevron down icon

Math is not a strict prerequisite for becoming a data analyst. More crucial are logical thinking and problem-solving skills. We focus heavily on these fundamentals and believe that with determination and the right effort, anyone can master data analytics.

I've tried learning data analytics but found it difficult. How can Sigma School help?
chevron down icon

Learning data analytics can indeed be challenging, which is why our program is designed to guide you through every step. Our instructors come from diverse backgrounds, including self-taught analysts and industry professionals, offering unique perspectives and support. We provide a clear, structured path for overcoming obstacles, including peer programming, mentorship, and hands-on problem-solving.

Why is a Bootcamp better than self-studying for data analytics?
chevron down icon

Self-study can be overwhelming and often lacks direction. Sigma School offers:

  • A beginner-friendly, structured path.
  • Access to experienced instructors and a community of peers.
  • Hands-on learning with real-world data analytics projects.
  • Comprehensive coverage of essential tools and technologies in data analytics.
Do I need a degree in a related field to get a job in data analytics?
chevron down icon

Not at all! Many successful data analysts and professionals in tech do not have degrees in related fields. Our bootcamp equips you with practical skills and a portfolio to demonstrate your capabilities, which are often more valued in the tech industry.

Can I join Sigma School while working a full-time job?
chevron down icon

Yes! Our Data Analytics Bootcamp is specifically designed to be part-time, making it ideal for those who are working or have other commitments. The course is intensive and requires dedication, but it's structured to be manageable alongside a full-time job.

What will I get when I enroll in the Data Analytics Bootcamp?
chevron down icon

Upon enrolling, you'll receive:

  • Comprehensive learning materials covering data analysis fundamentals, visualization, and various analytics tools.
  • Hands-on projects and assignments.
  • Unlimited mentorship and support for a year.
  • Access to a professional network and community.
  • A money-back guarantee if you don't secure a job in the field after graduation.
Is the material taught at Sigma School available online for free?
chevron down icon

While some resources are available online, finding a structured, comprehensive path is challenging. Sigma School offers a curated, streamlined learning experience with expert support, which is hard to replicate through self-study. Our aim is to accelerate your learning process, reducing the trial and error that often accompanies self-taught endeavors.

Do you offer group discounts for company training?
chevron down icon

Yes, we offer special pricing for teams. If multiple employees from your company are interested, please contact us atsupport@sigmaschool.co for more information on our group rates.

Will I receive a certificate after completing the bootcamp?
chevron down icon

Upon completion of the Data Analytics Bootcamp, you will receive a certificate from Sigma School. This certification will be a testament to your newly acquired skills in data analytics and can be added to your professional portfolio.

What can I do after completing the Data Analytics Bootcamp?
chevron down icon

After completing our course, you'll be equipped to pursue a career in data analytics. This includes roles like data analyst, business intelligence analyst, or any position requiring data visualization and analysis skills. You'll also have the foundational knowledge to further specialize in fields such as data science or big data.

I want to enroll now but am unsure about my schedule. What should I do?
chevron down icon

You can enroll now to secure your spot and decide on your schedule later. Our admissions team will work with you to find a batch that fits your schedule and ensures you get the most out of our program. These adjusted FAQs are tailored to the specifics of your Data Analytics Bootcamp, providing clear and helpful information to prospective students.